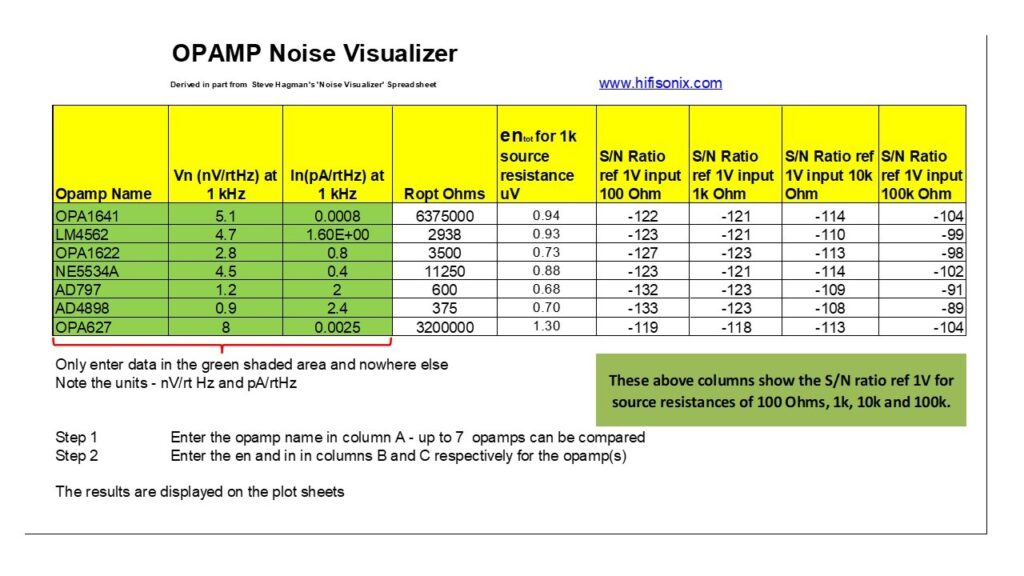
This Excel spread sheet tool was developed from one by Steve Hagman (www.AnalogHome.com) and allows en and ien data for up to 7 opamps to be compared. When using the tool, make sure you enter comparable data – so for example, always use the same frequency to make the comparison. I normally use 1 kHz worst case data. For LF noise (where 1/f noise usually dominates and an important consideration for phono equalizers), most manufacturers quote figures at 10Hz, so make sure if you are looking at LF noise data, you use similar frequency point data to make a fair comparison. The tool also contains a system level noise modeller, that allows a signal chain of up to 4 stages to be analyzed, and the resulting S/N ratio and equivalent noise resistor to be calculated.
(The tool was updated 2nd February 2020 after errors were noted by some users)
The definitive document on noise analysis is the classic National Semiconductor AN104 ‘Noise Specs confusing?’ which you can download here AN-104
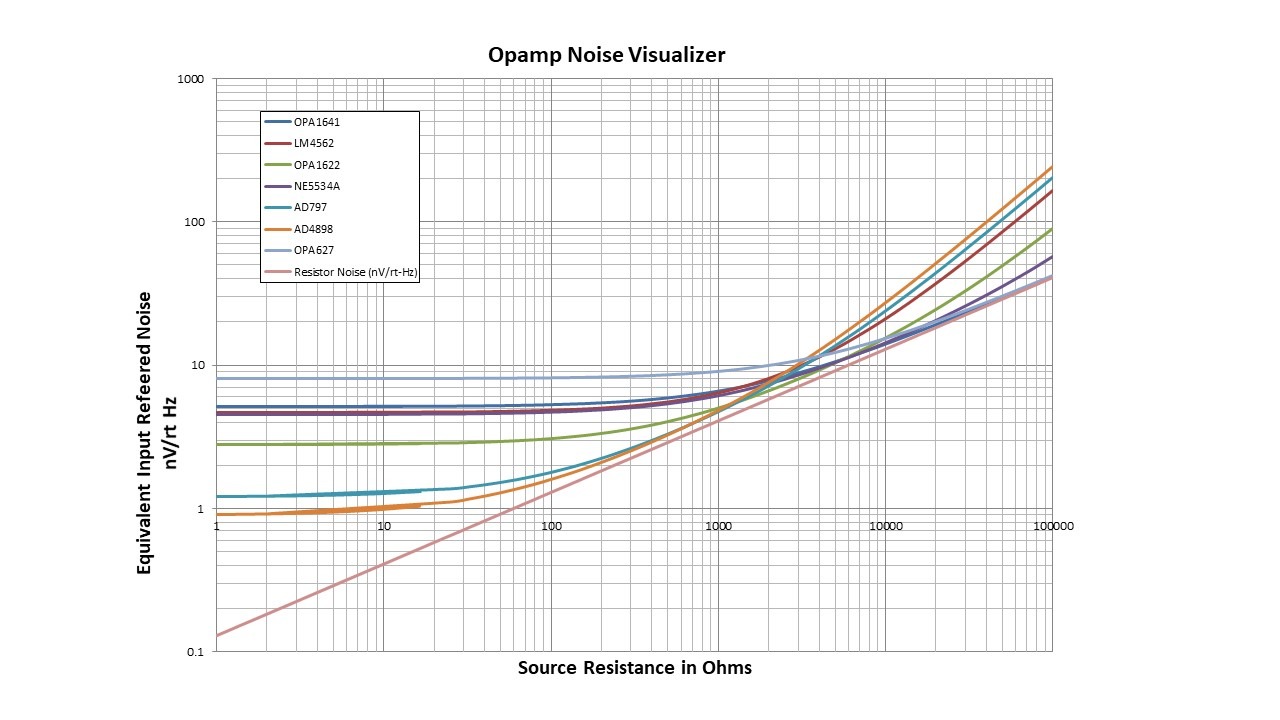
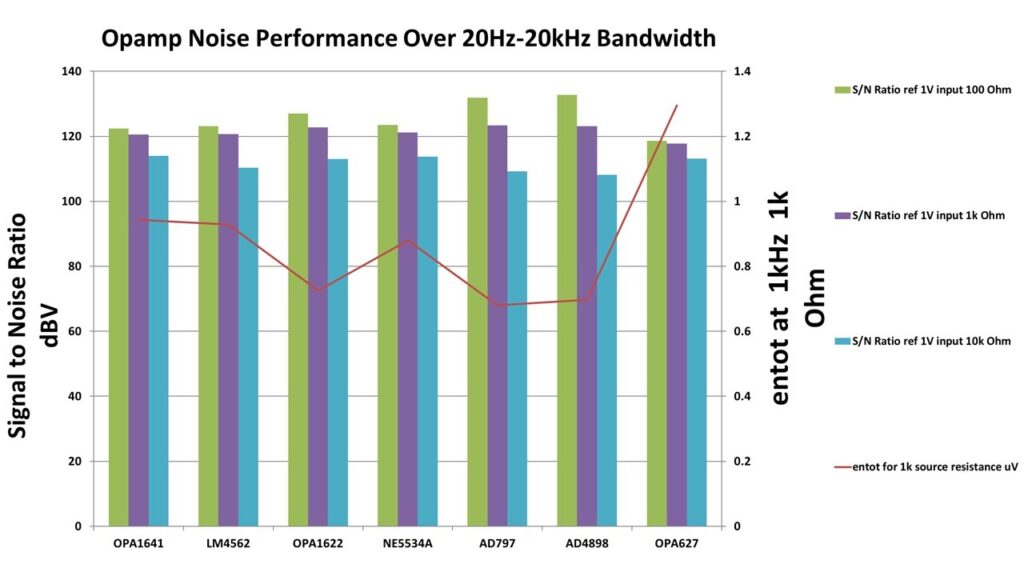
Below are some screen shots of the Noise Visualizer output.

Leave a Reply